Cell Invasion Assay (2D)

ORIS™ PRO INVASION ASSAY HAS BEEN DISCONTINUED. For substitute product, see 3D Embedded Invasion Assay


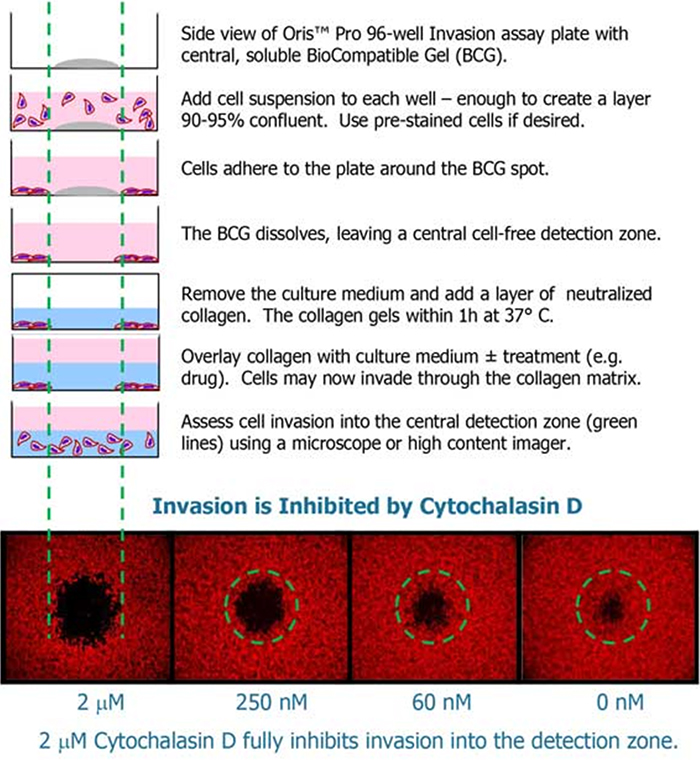
Cell Invasion Through a Collagen I Matrix Chart

Statistically Robust Results Compared with Transwell Assays
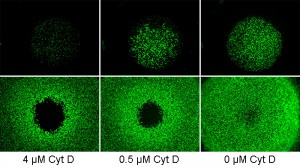
Oris™ Pro Invasion Assay vs Transwell AssayOris™ Pro vs Transwell assay data for inhibition of invasion by cytochalasin D. A popular transwell product and Oris™ Pro Invasion Assay were compared side-by-side using the same HT1080 cell passage for both systems. Assay results were quantified using fluorescence spectrophotometry and fluorescence microscopy. Upper panels, images of transwell assay wells, lower panels, images of Oris™ Pro Invasion Assay wells at the end of the assay.

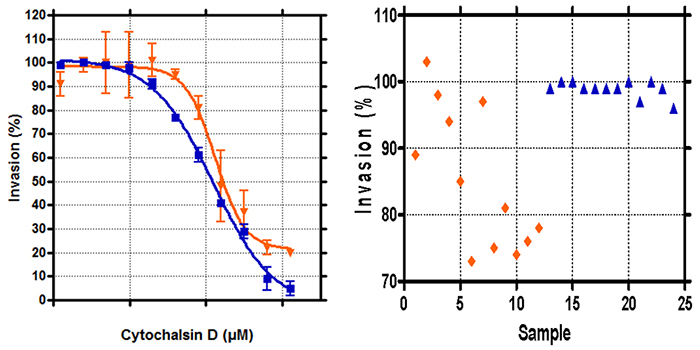
Oris™ Pro Invasion Assay Charts
Left chart shows dose dependent inhibition of invasion by Cytochalasin D with IC50 values of 0.4148 µM (Oris™, blue data points) and 0.3918 µM (transwell, orange data points). Right chart shows statistical evaluation resulting in Z’ values of only 0.50 for transwell (orange data points) but 0.89 for Oris™ Pro (blue data points).


*Oris™ is a trademark of Platypus Technologies, LLC. Oris™ Pro technology is patent pending.